Two open houses, same Saturday afternoon, ten minutes apart. The first is a two-bedroom at a full-service Seaport tower, listed north of $2 million, with a monthly HOA fee that alone would cover a mortgage payment in most American cities. The second is a loft conversion on Melcher Street in Fort Point, same price range, exposed brick, and a condo fee that looks almost modest by comparison. Both addresses will show up under "Seaport" on a portal search. Both will get averaged into the same median price. And a buyer trying to make sense of that median is going to walk away with the wrong number.
Seaport carries the highest price per square foot in Boston. That much shows up in every market report. What doesn't show up as clearly is that the number is really two markets stitched together, one behaving like a seller's dream and the other behaving like a buyer's opening.
The Number That Doesn't Split
As of March 2026, the Seaport core condo market posted a median sale price near $2.98 million and a median price per square foot around $1,940, with homes spending a median of 93 days on the market. That's a striking figure until you compare it to the neighborhoods right next door. In the same window, the broader South Boston Waterfront showed a median sale price of about $1.095 million with $996 per square foot and 54 days on market. Back Bay came in at a median of $1.4 million, $1,450 per square foot, and just 44 days on market.
Read side by side, the pattern is odd. Back Bay, with tighter historic inventory and a well-established buyer pool, moves faster than Seaport despite costing less per square foot. Seaport, the most expensive submarket in the city, takes twice as long to sell. That gap is the first clue that "Seaport" isn't one market behaving one way. It's a blend of two.
Why the Priciest Segment Is Also the Softest
The full-service towers, Echelon Seaport, St. Regis Residences, 50 Liberty, and 22 Liberty along Seaport Boulevard and Fan Pier, are where the real softness lives. St. Regis alone was sitting on roughly 47 unsold units earlier this year, and citywide, urban-core condo sales above $3 million fell about 35% year over year in the second quarter of 2026. A year-to-date market report for Seaport put months of supply at 12.9, well past the six-month line that typically separates a buyer's market from a seller's market, with the average condo taking 74 days just to get an offer accepted and closing at 95.5% of list price, down from 97.8% the year before.
None of that reads like a hot market. It reads like a segment where sellers are still pricing to last year's comps and buyers are taking their time. One market watcher summed it up simply: Seaport in 2026 is "a tale of two markets."
More full-service inventory is on the way, too. One Harbor Shore, a 122-residence project on Fan Pier, is under construction as the final phase of the Fan Pier master plan and is expected to deliver in late 2026 with the same concierge-and-wellness positioning as its neighbors. That's more competition landing in a segment that hasn't finished absorbing what it already has.
What Fort Point Buys Instead
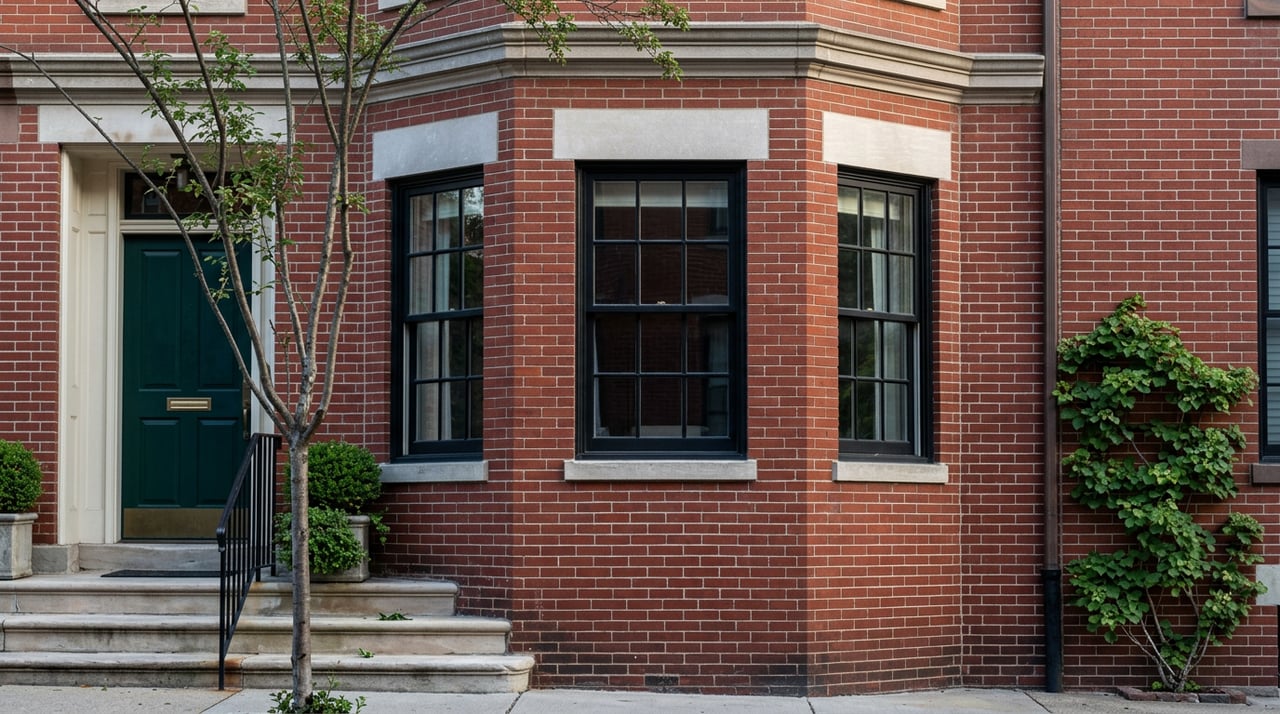
A few streets back from the glass towers, the picture flips. Fort Point's red-brick warehouse buildings, concentrated along Melcher and Summer Streets, have housed Boston's artist co-op community since the neighborhood's first Open Studios in 1980, decades before a single Seaport tower broke ground. Those buildings have been converted into loft-style condos with high ceilings, exposed beams, and factory-scale windows, and they trade at a real discount to the waterfront towers, generally in the $700 to $1,400 per square foot range rather than the $1,500-plus territory of buildings like 135 Seaport Boulevard or St. Regis.
Fee structures are simpler here too, without the payroll and pool maintenance that drive tower HOA budgets. That combination, lower entry price and lighter carrying costs, is a meaningful part of why mid-market Seaport product in the $900,000 to $1.8 million range has continued to move at a steadier pace than the segment above it, even while the neighborhood's most expensive listings sit and wait.
It's worth saying plainly that this shift hasn't been free for everyone. Rents in Fort Point have climbed enough that some of the original artist residents who built the neighborhood's identity have found it harder to stay. The character that makes these buildings desirable to buyers today is the same character that's becoming more expensive to hold onto.
The Fee Math Buyers Skip
Even within a single tower, the HOA gap between unit types is large enough to change the economics of a purchase. At 50 Liberty, current published fees range from about $947 to $2,460 a month depending on the unit. At St. Regis Residences, the range runs from $1,742 to $3,528, with at least one penthouse listing carrying fees above $5,800 a month.
Take the wider end of either range and run it forward. The difference between the low and high end of 50 Liberty's fee schedule works out to roughly $1,513 a month, or about $18,000 a year. Over a ten-year hold, that's more than $180,000 in carrying costs separating two units in the exact same building. At St. Regis, the spread is even wider, closer to $1,786 a month, or over $21,000 a year.
That's not a cost that shows up in a portal's price-per-square-foot headline. It shows up in the HOA budget and the reserve study, documents most buyers don't read closely until they're already under contract. We've written before about what to look for in those documents before you sign anything.
What This Means If You're Comparing Neighborhoods
If you're weighing Seaport against Back Bay or the South Boston Waterfront on price alone, you're comparing an average against two real, well-defined markets. A buyer priced out of Back Bay's tighter, faster-moving inventory might assume Seaport is simply more expensive across the board. It isn't. It's more expensive at the top, where a combination of high fees and incoming supply is giving buyers real room to negotiate, and it's genuinely competitive in the middle, where Fort Point's lower fees and lower entry price keep demand steady.
The practical takeaway is to ask which Seaport a listing actually belongs to before comparing it to anything else. A $3 million-plus tower unit today is a negotiation. A Fort Point loft in the high six figures is a market where you'll still need to move quickly. Treating both as the same neighborhood at the offer table is how buyers either overpay for amenities they won't use or lose out on a loft they should have moved on faster.
Frequently Asked Questions
Is Seaport a buyer's market or a seller's market right now? Both, depending on price point. Above roughly $3 million, months of supply and falling sale-to-list ratios point toward buyers. In the mid-market, particularly in Fort Point loft conversions, competition remains real.
Should I count Fort Point as part of Seaport when I'm comparing prices? Many buyers and some brokers treat it as a distinct submarket rather than part of the Seaport core, since the building stock, price per square foot, and fee structures behave so differently. It's worth asking how any comp set you're shown defines the boundary.
How much should I budget for condo fees at a full-service Seaport building? Published fee schedules this year have ranged from under $1,000 a month to over $5,800 a month depending on the building and unit. Always ask for the last three years of HOA minutes and the current reserve study before you factor a fee into your monthly budget.
If you're trying to figure out which version of Seaport actually fits your budget and your plans, that's exactly the kind of building-by-building comparison the Steph Crawford Group walks through with clients before they ever write an offer. Start with a look at current Seaport neighborhood data, or get in touch to talk through what a specific building's numbers mean for your search.